
Data
Extrapolate Statistics Apron Features White Typography
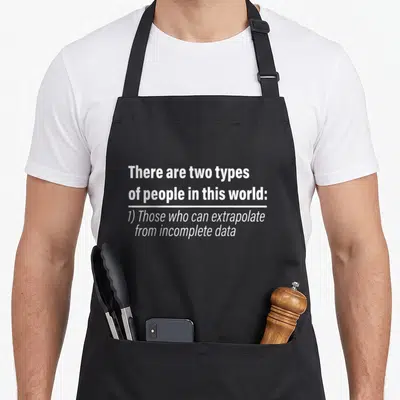
Extrapolate statistics apron - White text reading two types of people extrapolating incomplete data separated by a bar
US$19.95
Flat US$4.95 US shipping · free over US$65.00 · sales tax is calculated from your shipping address at checkout.
1
US$19.95
Delivery to United States
Arrives —
Orders ship within the United States only. Flat US$4.95 shipping under US$65.00 — free from US$65.00.
Returns
Request a return or exchange within 30 days of purchase, for any reason — we cover return shipping.
Printed to order
Every apron is printed after you order it. Please allow 1-3 business days for processing before it leaves the print shop.
Extrapolate Statistics Apron Features White Typography is printed on a black canvas apron — one size, made to order and shipped within the United States.
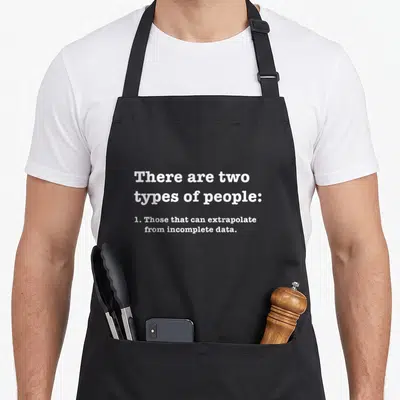
extrapolate statistics apron puts the phrase There are two types of people in this world: 1) Those who can extrapolate, from incomplete data across the front panel, and the text reads as a pun about statistical literacy. Wearing it signals that you enjoy solving problems with missing information, and statisticians or data analysts feel this was made specifically for them.
A Closer Look At The Artwork
White typography dominates the front panel in a strict four-line stack that commands attention through layout alone. A solid white horizontal bar separates the second and third lines, creating a visual pause that mimics a spreadsheet divider or a line break in a dataset. The first section declares There are two types of people in this world: while the lower section completes the thought with 1) Those who can extrapolate, from incomplete data. This minimalist approach uses no illustrations, relying instead on the stark contrast of white lettering against the background to convey its message. The design belongs to the realm of academic wordplay where the joke is the data itself rather than a picture of data. By presenting the statement as a numbered list item, the print adopts the formal structure of a report or a textbook definition. This integration of form and content ensures the viewer understands the reference immediately without needing external context.
Where It Earns Its Keep
Lecturers and researchers in quantitative fields notice the specific terminology used in the phrase first. Gifting an extrapolate statistics apron to a graduate student or a junior analyst acknowledges their unique skill set during birthdays or anniversaries. The garment proves useful in university labs or office kitchens where discussing sample sizes and prediction models is part of the daily routine.
Good To Know
What is the width of the pockets on this apron? The pockets measure exactly 8 inches wide by 7 inches tall on each side. This dimension provides ample space for holding notebooks or calculators while the 10 oz cotton canvas maintains enough stiffness to prevent sagging when filled with heavy equipment.
How should I wash the design to keep the ink intact? You should turn the garment inside out and wash it in cold water to preserve the white lettering. The fabric softens naturally after two or three washes, which actually helps the ink flex with the material rather than cracking under repeated movement.
Does the design imply there is a second category of people listed? No, the design intentionally omits a second option to reinforce the joke about having insufficient information. The text explicitly lists only item number one, leaving the reader to infer that everyone else lacks this specific analytical ability.
Every apron is printed after you order it. Orders are processed Monday through Friday, excluding federal holidays — please allow 1-3 business days for order processing. After processing, shipping typically takes 3-7 business days inside the United States, so the total delivery time from order placement is 4-10 business days.
US orders under US$65.00 pay a flat US$4.95 shipping; orders of US$65.00 or more ship free. Bearhap ships within the United States only — we do not ship to international addresses.
You may request a return or exchange within 30 days of the purchase date, for any reason. The apron must be unopened, unused and in its original packaging, with proof of purchase. We refund the item price in full to the original payment method — the original US$4.95 shipping fee is not refundable — and Bearhap covers all return shipping costs: email contact@bearhap.com for a free return label.
Care
Machine wash cold, inside out, with like colours. Tumble dry low or hang to dry. Do not iron directly over the print — press from the back if you need to. No bleach, no dry cleaning.
The ink is water-based and cures into the fabric, so it will soften with the canvas rather than peel off it.
Questions about Data aprons
- Who should buy this apron?
- This collection is ideal for software engineers, data analysts, and IT professionals who enjoy workplace humor. It also appeals to computer science students and teachers who want to display their passion for technology through witty, niche-specific graphic designs on durable canvas bibs.
- What themes are included?
- The assortment covers programming concepts like parameters, data extrapolation, and incomplete datasets. It also includes playful elements such as cats and emotional data mappings. Each design reflects specific aspects of the tech industry, from coding challenges to classroom education environments.
- How do I choose?
- Select based on your specific role or favorite technical concept. Developers might prefer parameter or generation themes. Educators may like the classroom-friendly options. Cat enthusiasts can choose the feline print. Pick the design that best matches your daily work environment or personal sense of style.
You might also like
More data
- incomplete data apron
- extrapolate nerd apron
- extrapolate data apron
- incomplete data jokes apron
- those class funny apron
- programming nerd apron
- intelligentshirt novelty apron
- those statistics apron