
Data
Show Data Apron Features White Stacked Typography Reading
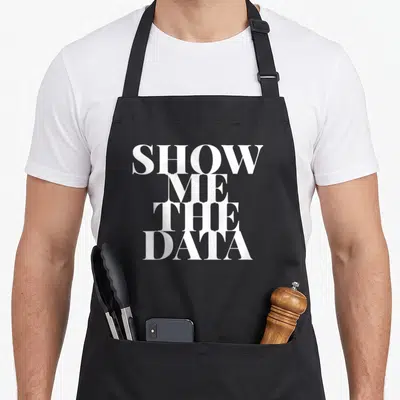
Show data apron - White stacked text reading SHOW ME THE DATA on black fabric
US$19.95
Flat US$4.95 US shipping · free over US$65.00 · sales tax is calculated from your shipping address at checkout.
1
US$19.95
Delivery to United States
Arrives —
Orders ship within the United States only. Flat US$4.95 shipping under US$65.00 — free from US$65.00.
Returns
Request a return or exchange within 30 days of purchase, for any reason — we cover return shipping.
Printed to order
Every apron is printed after you order it. Please allow 1-3 business days for processing before it leaves the print shop.
Show Data Apron Features White Stacked Typography Reading is printed on a black canvas apron — one size, made to order and shipped within the United States.
show data apron puts the phrase SHOW ME THE DATA across the front panel, and the words land as a direct request for empirical evidence rather than a humorous quip. Wearing it establishes a boundary between opinion and fact, and statisticians who prioritize hard numbers feel this was made specifically for their workflow.
Inside The Artwork
White typography dominates the center of the black bib, forming the only visual element on this garment. The letters are arranged in two distinct horizontal rows, creating a stacked layout that draws the eye directly to the chest area. The font style is bold and sans-serif, ensuring legibility even from a distance without any decorative flourishes or graphic embellishments. This minimalist approach aligns with the discipline of statistics, where clarity and precision take precedence over artistic flair. The stark contrast between the white characters and the dark background reinforces the serious nature of the message, signaling that the wearer values data integrity above all else.
Who It Speaks To
Mathematical statisticians and science educators notice the immediate demand for proof upon seeing this show data apron. It functions as an ideal gift for graduates entering academia or professionals seeking to express their analytical identity in a practical setting. The design suits everyday situations in university labs, corporate analytics teams, or home kitchens where rigorous standards apply. Unlike novelty items, this piece communicates a specific intellectual stance through its unadorned presentation.
Quick Answers
What are the dimensions of the neck strap on this product? The neck strap measures between 20 and 30 inches in length, providing a wide range of adjustment to accommodate various body sizes. This flexibility ensures that users of different heights can secure the apron comfortably around their neck without discomfort or slippage during movement.
How does the white ink hold up after repeated washing cycles? The white ink is printed directly onto the durable black fabric, which resists fading and cracking over time. Proper care maintains the crispness of the lettering, preserving the sharp contrast needed for the text to remain readable through multiple washes.
Does this design include any mathematical symbols or charts? No, this design contains only the printed words and excludes any graphs, equations, or numerical symbols. The focus remains strictly on the textual command, making it distinct from other data-themed apparel that incorporates visual representations of information.
Every apron is printed after you order it. Orders are processed Monday through Friday, excluding federal holidays — please allow 1-3 business days for order processing. After processing, shipping typically takes 3-7 business days inside the United States, so the total delivery time from order placement is 4-10 business days.
US orders under US$65.00 pay a flat US$4.95 shipping; orders of US$65.00 or more ship free. Bearhap ships within the United States only — we do not ship to international addresses.
You may request a return or exchange within 30 days of the purchase date, for any reason. The apron must be unopened, unused and in its original packaging, with proof of purchase. We refund the item price in full to the original payment method — the original US$4.95 shipping fee is not refundable — and Bearhap covers all return shipping costs: email contact@bearhap.com for a free return label.
Care
Machine wash cold, inside out, with like colours. Tumble dry low or hang to dry. Do not iron directly over the print — press from the back if you need to. No bleach, no dry cleaning.
The ink is water-based and cures into the fabric, so it will soften with the canvas rather than peel off it.
Questions about Data aprons
- Who should buy this apron?
- This collection is ideal for software engineers, data analysts, and IT professionals who enjoy workplace humor. It also appeals to computer science students and teachers who want to display their passion for technology through witty, niche-specific graphic designs on durable canvas bibs.
- What themes are included?
- The assortment covers programming concepts like parameters, data extrapolation, and incomplete datasets. It also includes playful elements such as cats and emotional data mappings. Each design reflects specific aspects of the tech industry, from coding challenges to classroom education environments.
- How do I choose?
- Select based on your specific role or favorite technical concept. Developers might prefer parameter or generation themes. Educators may like the classroom-friendly options. Cat enthusiasts can choose the feline print. Pick the design that best matches your daily work environment or personal sense of style.
You might also like
More data
- extrapolate data apron
- data scientist science apron
- analyst science apron
- analytic science apron
- data apron or apron
- data psychologist apron
- those statistics apron
- tired function of apron